In today’s data-driven world, the ability to analyze data efficiently is crucial for businesses and individuals alike. With advancements in artificial intelligence (AI), numerous free tools have emerged that can significantly enhance the data analysis process. This article explores various free AI tools available for data analysis, providing insights, step-by-step guides, and practical examples.
Understanding the Importance of AI in Data Analysis
Data analysis involves inspecting, cleaning, and modeling data to discover useful information, inform conclusions, and support decision-making. AI tools can automate many aspects of this process, enabling analysts to focus on more complex inquiries. Here are some key benefits of using AI in data analysis:
- Efficiency: AI tools can process large datasets quickly, reducing the time required for analysis.
- Accuracy: Machine learning algorithms can identify patterns and anomalies that might be missed by human analysts.
- Scalability: AI tools can handle increasing volumes of data without a proportional increase in effort.
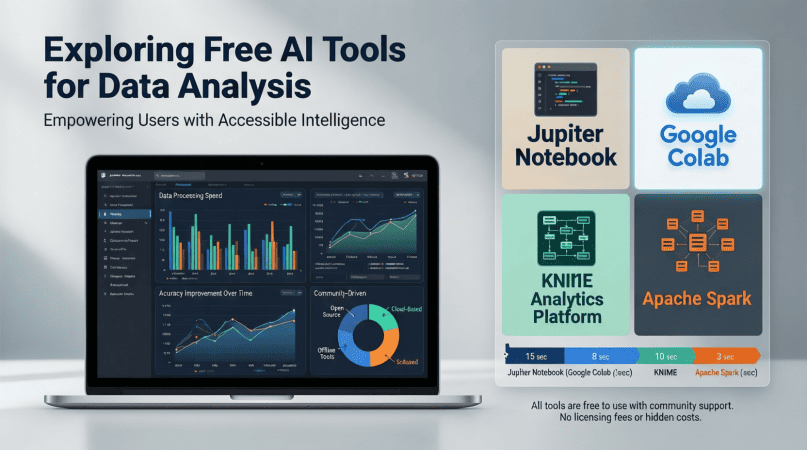
Top Free AI Tools for Data Analysis
Below are some of the most popular and effective free AI tools for data analysis:
1. Google Colab
Google Colab is a cloud-based Jupyter notebook environment that allows users to write and execute Python code in their browser. It is especially popular for machine learning and data analysis tasks.
Features:
- Free access to GPUs for faster computation
- Integration with Google Drive for easy data storage
- Collaboration features for team projects
Example Use Case:
To analyze a dataset using Google Colab, follow these steps:
- Create a new notebook in Google Colab.
- Upload your dataset to Google Drive and import it into the notebook.
- Use libraries like Pandas for data manipulation and Matplotlib for visualization.
- Run machine learning models using Scikit-learn.
2. RapidMiner
RapidMiner is a powerful data science platform that offers a free version with numerous tools for data preparation, machine learning, and predictive analytics.
Features:
- User-friendly drag-and-drop interface
- Support for various data formats
- Extensive library of algorithms and models
Example Use Case:
To perform a predictive analysis using RapidMiner:
- Download and install RapidMiner.
- Import your dataset into the workspace.
- Use the ‘Data Preparation’ tools to clean and transform your data.
- Select a predictive model and configure its parameters.
- Run the model and interpret the results.
3. KNIME
KNIME (Konstanz Information Miner) is an open-source data analytics platform that provides a graphical interface for creating data workflows.
Features:
- Integration with various data sources, including databases and web services
- Wide range of pre-built components for data processing
- Support for R and Python scripting
Example Use Case:
To analyze data using KNIME:
- Download and install KNIME.
- Create a new workflow and import your dataset.
- Use nodes to clean, analyze, and visualize your data.
- Export the results in your desired format.
Step-by-Step Guide to Using AI Tools for Data Analysis
Here’s a general step-by-step guide to effectively using AI tools for data analysis:
Step 1: Define Your Objectives
Clearly outline what you want to achieve with your data analysis. This could be identifying trends, making predictions, or evaluating performance.
Step 2: Collect Your Data
Gather the data you need from various sources, such as databases, CSV files, or APIs.
Step 3: Clean Your Data
Use data cleaning techniques to handle missing values, remove duplicates, and ensure consistency.
Step 4: Choose the Right AI Tool
Select an AI tool that best fits your needs and skills. For instance, if you prefer a coding environment, consider Google Colab.
Step 5: Analyze Your Data
Utilize the features of your chosen tool to conduct analysis. This may involve statistical analysis, machine learning, or visualization.
Step 6: Interpret Results
Review the results of your analysis and draw meaningful conclusions based on your objectives.
Step 7: Share Your Findings
Prepare visualizations and reports to communicate your findings effectively to stakeholders.
Checklist for Using AI Tools in Data Analysis
| Task | Status |
|---|---|
| Define analysis objectives | [ ] |
| Gather necessary data | [ ] |
| Clean and preprocess data | [ ] |
| Select appropriate AI tool | [ ] |
| Conduct analysis | [ ] |
| Interpret results | [ ] |
| Prepare reports/visualizations | [ ] |
Visualizing Data Analysis Results
Data visualization is a crucial aspect of data analysis. Effective visuals can help present complex data in an accessible manner. Below are some popular visualization techniques:
- Bar Charts: Useful for comparing quantities across different categories.
- Line Graphs: Ideal for showing trends over time.
- Scatter Plots: Effective for identifying relationships between two variables.
Using tools like Matplotlib or Seaborn in Python, you can create stunning visualizations directly from your data analysis results.
Conclusion
Free AI tools for data analysis have revolutionized the way we approach data. By automating processes, enhancing accuracy, and providing scalability, these tools empower users to gain deeper insights from their data. Whether you are a data analyst, a business professional, or a student, leveraging these tools can significantly enhance your analytical capabilities.
For further insights and a comprehensive list of AI tools, check out our Ultimate Guide to Free AI Tools.